The central component of the monitoring system is InfluxDB, a time series database which keeps raw statistics from all equipment. The following guide assumes that Docker Package is already installed.
- download InfluxDB
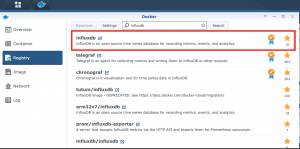
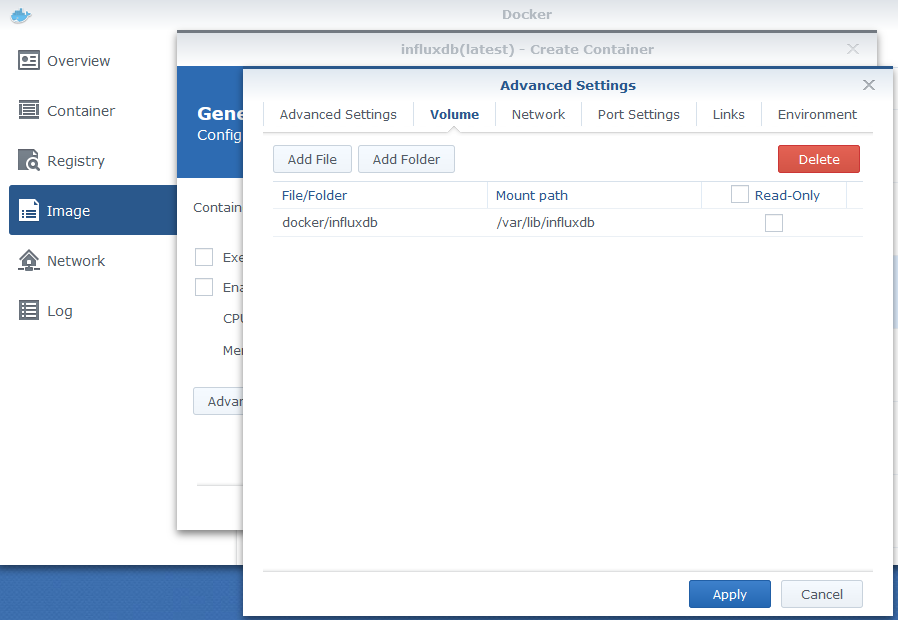
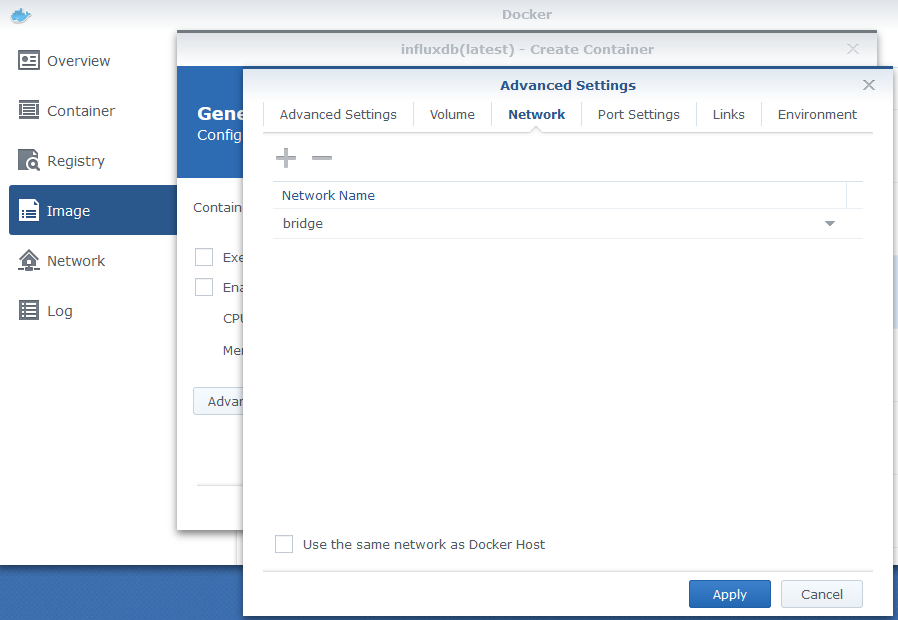
- launch the downloaded image and create the container with following parameters:
- map volume docker/influxdb to /var/lib/influxdb
- map port 8086 (local port) to 8086 TCP (container port)
- use the default Bridge Network

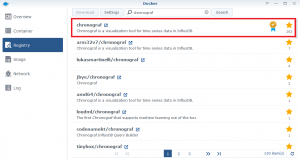
In addition to InfluxDB, the actual database, it is useful to install Chronograf that is a GUI that eases the management.
- download Chronograf
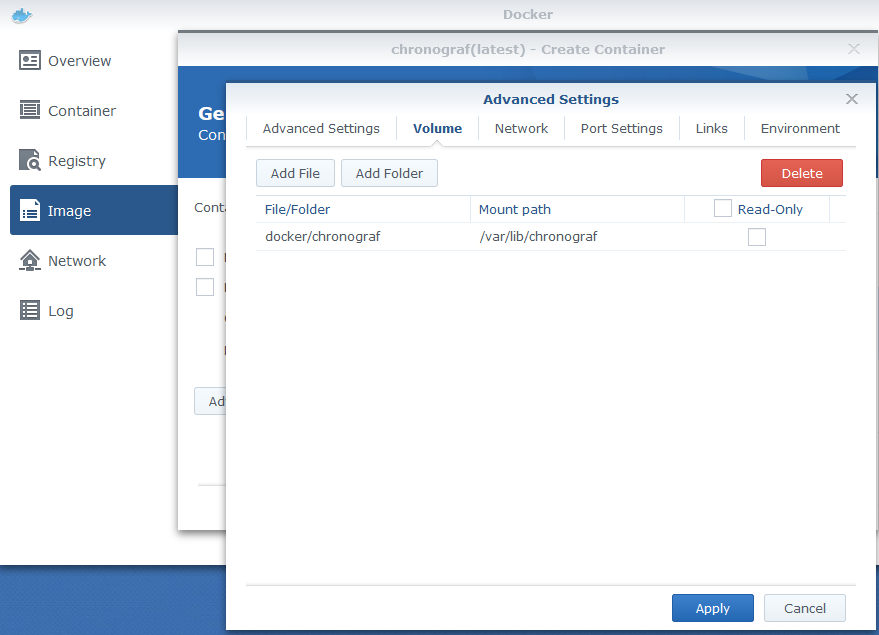
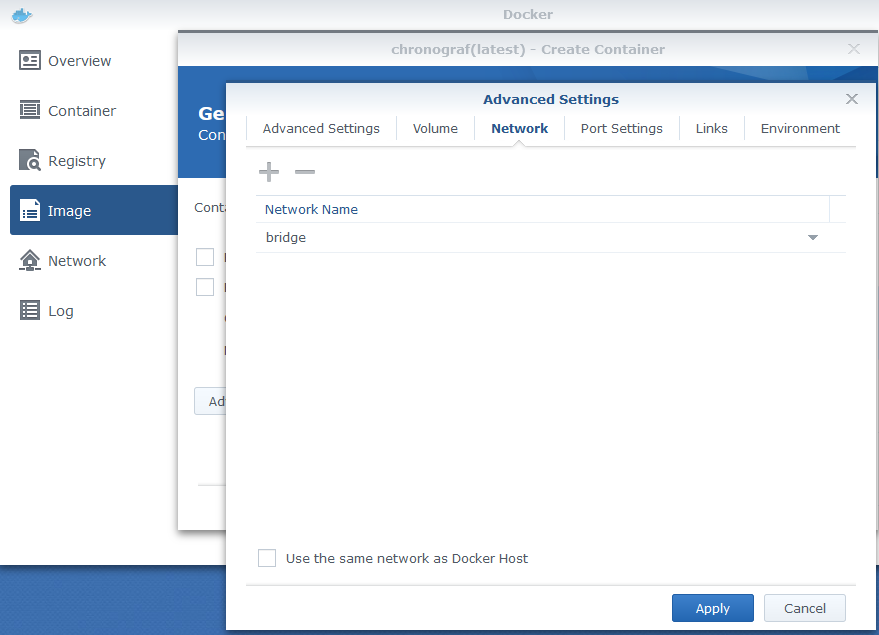
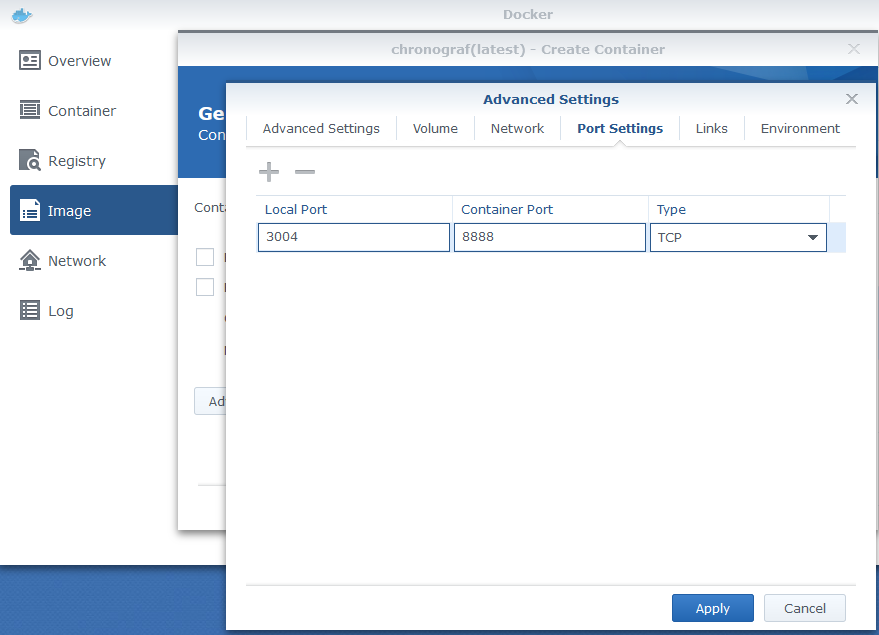
- launch the downloaded image and create the container with following parameters:
- map volume docker/chronograf to /var/lib/chronograf
- map port 3004 (local port) to 8888 TCP (container port)
- use the default Bridge Network
Once both InfluxDB and Chronograf installed, create the database via the GUI:
- browse to Chronograf: http://docker_host_IP_address:3004 and configure your connection to InfluxDB (second panel and skip the rest)
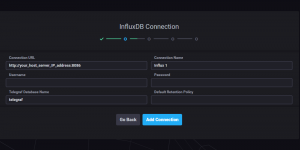
- You can now use Chronograf to explore your InfluxDB databases when you need
- download Telegraf image
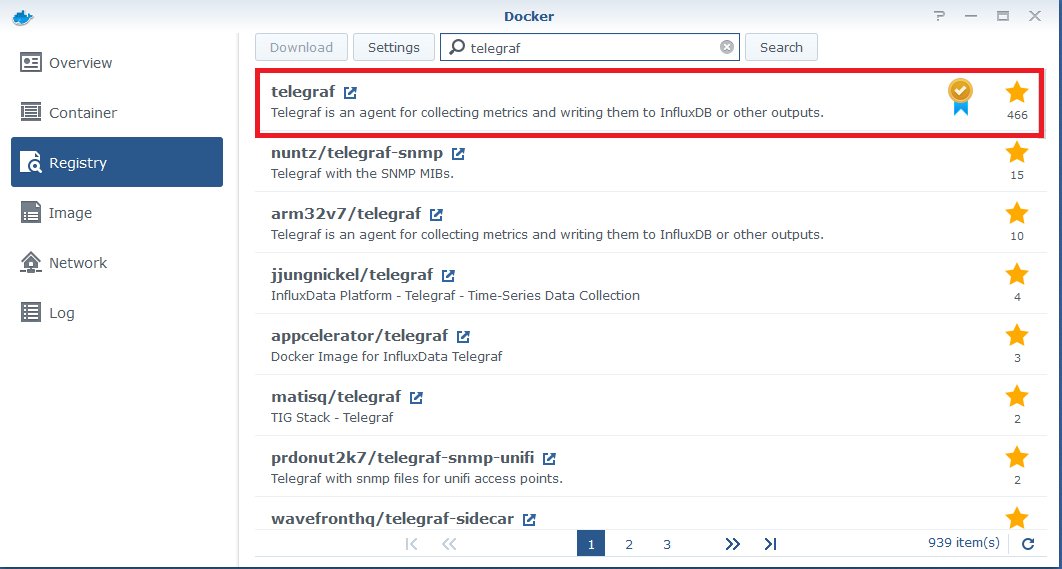
- launch the downloaded image to create the container with following settings
-
- map Volumes docker/telegraf/config to /etc/telegraf, docker/telegraf/logs to /var/log/telegraf and docker/telegraf/mibs to /usr/share/snmp/mibs
- map Port Auto (local port) to 8094 TCP (container port)
- use the default Docker Bridge network
- in order to inform Telegraf which MIBs to collect (in this case MIBs from Synology and USG Router), open the default docker/telegraf/configuration/telegraf.conf and modify / add the following:
###############################################################################
# OUTPUTS #
###############################################################################

# Configuration for influxdb server to send metrics to
[[outputs.influxdb]]
# The full HTTP or UDP endpoint URL for your InfluxDB instance.
# Multiple urls can be specified but it is assumed that they are part of the same
# cluster, this means that only ONE of the urls will be written to each interval.
urls = ["http://your_Synology_IP_address:8086"] # required - enter the IP address of your InfluxDB instance

# The target database for metrics (telegraf will create it if not exists)
database = "SYNOLOGY_STATS_DB" # required

username = "username_of_your_database"
password = "password_of_your_database"
# Set the user agent for HTTP POSTs (can be useful for log differentiation)
# user_agent = "telegraf"
# Set UDP payload size, defaults to InfluxDB UDP Client default (512 bytes)
# udp_payload = 512


###############################################################################
# INPUTS #
###############################################################################

# Read metrics about system load & uptime
[[inputs.system]]
# no configuration
# Read metrics about processes
[[inputs.processes]]
# no configuration
[[inputs.mem]]
# no configuration
[[inputs.net]]
# no configuration
[[inputs.netstat]]
# no configuration

# Read metrics about disk IO by device
#[[inputs.diskio]]
## By default, telegraf will gather stats for all devices including
## disk partitions.
## Setting devices will restrict the stats to the specified devices.
# devices = ["sda", "sdb"]
## Uncomment the following line if you need disk serial numbers.
# skip_serial_number = false

## Read metrics about Docker
[[inputs.docker]]
endpoint = "tcp://your_Synology_IP_address:2375"
container_names = []

# Synology
[[inputs.snmp]]
agents = [ "your_Synology_IP_address" ]
interval = "60s"
timeout = "30s"
retries = 3
version = 2
community = "public"
max_repetitions = 30
name = "snmp.SYNO"
[[inputs.snmp.field]]
is_tag = true
name = "sysName"
oid = "RFC1213-MIB::sysName.0"
# System vendor OID
[[inputs.snmp.field]]
name = "sysObjectID"
oid = "RFC1213-MIB::sysObjectID.0"
# System description
[[inputs.snmp.field]]
name = "sysDescr"
oid = "RFC1213-MIB::sysDescr.0"
# System contact
[[inputs.snmp.field]]
name = "sysContact"
oid = "RFC1213-MIB::sysContact.0"
# System location
[[inputs.snmp.field]]
name = "sysLocation"
oid = "RFC1213-MIB::sysLocation.0"
# System uptime
[[inputs.snmp.field]]
name = "sysUpTime"
oid = "RFC1213-MIB::sysUpTime.0"
# Inet interface
[[inputs.snmp.table]]
oid = "IF-MIB::ifTable"
[[inputs.snmp.table.field]]
is_tag = true
oid = "IF-MIB::ifDescr"
[[inputs.snmp.table.field]]
name = "in"
oid = "IF-MIB::ifHCInOctets"
[[inputs.snmp.table.field]]
name = "out"
oid = "IF-MIB::ifHCOutOctets"

#Syno disk
[[inputs.snmp.table]]
oid = "SYNOLOGY-DISK-MIB::diskTable"
[[inputs.snmp.table.field]]
is_tag = true
oid = "SYNOLOGY-DISK-MIB::diskID"
#Syno raid
[[inputs.snmp.table]]
oid = "SYNOLOGY-RAID-MIB::raidTable"
[[inputs.snmp.table.field]]
is_tag = true
oid = "SYNOLOGY-RAID-MIB::raidName"
#Syno load
[[inputs.snmp.table]]
oid = "UCD-SNMP-MIB::laTable"
[[inputs.snmp.table.field]]
is_tag = true
oid = "UCD-SNMP-MIB::laNames"
# System memTotalSwap
[[inputs.snmp.field]]
name = "memTotalSwap"
oid = "UCD-SNMP-MIB::memTotalSwap.0"
# System memAvailSwap
[[inputs.snmp.field]]
name = "memAvailSwap"
oid = "UCD-SNMP-MIB::memAvailSwap.0"
# System memTotalReal
[[inputs.snmp.field]]
name = "memTotalReal"
oid = "UCD-SNMP-MIB::memTotalReal.0"
# System memAvailReal
[[inputs.snmp.field]]
name = "memAvailReal"
oid = "UCD-SNMP-MIB::memAvailReal.0"
# System memTotalFree
[[inputs.snmp.field]]
name = "memTotalFree"
oid = "UCD-SNMP-MIB::memTotalFree.0"
# System Status
[[inputs.snmp.field]]
name = "systemStatus"
oid = "SYNOLOGY-SYSTEM-MIB::systemStatus.0"
# System temperature
[[inputs.snmp.field]]
name = "temperature"
oid = "SYNOLOGY-SYSTEM-MIB::temperature.0"
# System powerStatus
[[inputs.snmp.field]]
name = "powerStatus"
oid = "SYNOLOGY-SYSTEM-MIB::powerStatus.0"
# System systemFanStatus
[[inputs.snmp.field]]
name = "systemFanStatus"
oid = "SYNOLOGY-SYSTEM-MIB::systemFanStatus.0"
# System cpuFanStatus
[[inputs.snmp.field]]
name = "cpuFanStatus"
oid = "SYNOLOGY-SYSTEM-MIB::cpuFanStatus.0"
# System modelName
[[inputs.snmp.field]]
name = "modelName"
oid = "SYNOLOGY-SYSTEM-MIB::modelName.0"
# System serialNumber
[[inputs.snmp.field]]
name = "serialNumber"
oid = "SYNOLOGY-SYSTEM-MIB::serialNumber.0"
# System version
[[inputs.snmp.field]]
name = "version"
oid = "SYNOLOGY-SYSTEM-MIB::version.0"
# System upgradeAvailable
[[inputs.snmp.field]]
name = "upgradeAvailable"
oid = "SYNOLOGY-SYSTEM-MIB::upgradeAvailable.0"
# System volume
[[inputs.snmp.table]]
oid = "HOST-RESOURCES-MIB::hrStorageTable"
[[inputs.snmp.table.field]]
is_tag = true
oid = "HOST-RESOURCES-MIB::hrStorageDescr"
# System ssCpuUser
[[inputs.snmp.field]]
name = "ssCpuUser"
oid = ".1.3.6.1.4.1.2021.11.9.0"
# System ssCpuSystem
[[inputs.snmp.field]]
name = "ssCpuSystem"
oid = ".1.3.6.1.4.1.2021.11.10.0"
# System ssCpuIdle
[[inputs.snmp.field]]
name = "ssCpuIdle"
oid = ".1.3.6.1.4.1.2021.11.11.0"
# Service users CIFS
[[inputs.snmp.table.field]]
name = "usersCIFS"
oid = "SYNOLOGY-SERVICES-MIB::serviceUsers"
oid_index_suffix = "1"
# Service users AFP
[[inputs.snmp.table.field]]
name = "usersAFP"
oid = "SYNOLOGY-SERVICES-MIB::serviceUsers"
oid_index_suffix = "2"
# Service users NFS
[[inputs.snmp.table.field]]
name = "usersNFS"
oid = "SYNOLOGY-SERVICES-MIB::serviceUsers"
oid_index_suffix = "3"
# Service users FTP
[[inputs.snmp.table.field]]
name = "usersFTP"
oid = "SYNOLOGY-SERVICES-MIB::serviceUsers"
oid_index_suffix = "4"
# Service users SFTP
[[inputs.snmp.table.field]]
name = "usersSFTP"
oid = "SYNOLOGY-SERVICES-MIB::serviceUsers"
oid_index_suffix = "5"
# Service users HTTP
[[inputs.snmp.table.field]]
name = "usersHTTP"
oid = "SYNOLOGY-SERVICES-MIB::serviceUsers"
oid_index_suffix = "6"
# Service users TELNET
[[inputs.snmp.table.field]]
name = "usersTELNET"
oid = "SYNOLOGY-SERVICES-MIB::serviceUsers"
oid_index_suffix = "7"
# Service users SSH
[[inputs.snmp.table.field]]
name = "usersSSH"
oid = "SYNOLOGY-SERVICES-MIB::serviceUsers"
oid_index_suffix = "8"
# Service users OTHER
[[inputs.snmp.table.field]]
name = "usersOTHER"
oid = "SYNOLOGY-SERVICES-MIB::serviceUsers"
oid_index_suffix = "9"
## UPS Details
[[inputs.snmp.field]]
name = "upsModel"
oid = "SYNOLOGY-UPS-MIB::upsDeviceModel.0"
[[inputs.snmp.field]]
name = "upsStatus"
oid = "SYNOLOGY-UPS-MIB::upsInfoStatus.0"
[[inputs.snmp.field]]
name = "upsLoad"
oid = "SYNOLOGY-UPS-MIB::upsInfoLoadValue.0"
[[inputs.snmp.field]]
name = "upsBatteryCharge"
oid = "SYNOLOGY-UPS-MIB::upsBatteryChargeValue.0"
[[inputs.snmp.field]]
name = "upsBatteryChargeLow"
oid = "SYNOLOGY-UPS-MIB::upsBatteryChargeLow.0"
[[inputs.snmp.field]]
name = "upsBatteryChargeWarning"
oid = "SYNOLOGY-UPS-MIB::upsBatteryChargeWarning.0"
[[inputs.snmp.field]]
name = "upsBatteryVoltage"
oid = "SYNOLOGY-UPS-MIB::upsBatteryVoltageValue.0"
[[inputs.snmp.field]]
name = "upsBatteryRuntime"
oid = "SYNOLOGY-UPS-MIB::upsBatteryRuntimeValue.0"
[[inputs.snmp.field]]
name = "upsInputVoltage"
oid = "SYNOLOGY-UPS-MIB::upsInputVoltageValue.0"

#
# Unifi Security Gateway
#
[[inputs.snmp]]
# List of agents to poll
agents = [ "your_USG_Router_IP_address" ] # required - enter the IP address of your USG device

# Polling interval
interval = "60s"

# Timeout for each SNMP query.
timeout = "10s"

# Number of retries to attempt within timeout.
retries = 3

# SNMP version, UAP only supports v1
version = 2

# SNMP community string.
community = "public"

# The GETBULK max-repetitions parameter
max_repetitions = 30

# Measurement name
name = "snmp.usg"

# Get WAN (eth0) and LAN (eth2) I/O counters

# Octets in on interface eth0
[[inputs.snmp.field]]
name = "eth0octetsIn"
oid = "IF-MIB::ifHCInOctets.2"

# Octets out on interface eth0
[[inputs.snmp.field]]
name = "eth0octetsOut"
oid = "IF-MIB::ifHCOutOctets.2"

# Octets in on interface eth2
[[inputs.snmp.field]]
name = "eth2octetsIn"
oid = "IF-MIB::ifHCInOctets.4"

# Octets out on interface eth2
[[inputs.snmp.field]]
name = "eth2octetsOut"
oid = "IF-MIB::ifHCOutOctets.4"

## System details
# System name (hostname)
[[inputs.snmp.field]]
name = "sysName"
oid = "SNMPv2-MIB::sysName.0"
is_tag = true
# System vendor OID
[[inputs.snmp.field]]
name = "sysObjectID"
oid = "SNMPv2-MIB::sysObjectID.0"
# System description
[[inputs.snmp.field]]
name = "sysDescr"
oid = "SNMPv2-MIB::sysDescr.0"
# System contact
[[inputs.snmp.field]]
name = "sysContact"
oid = "SNMPv2-MIB::sysContact.0"
# System location
[[inputs.snmp.field]]
name = "sysLocation"
oid = "SNMPv2-MIB::sysLocation.0"
## Host/System Resources
# System uptime
[[inputs.snmp.field]]
name = "sysUpTime"
oid = "HOST-RESOURCES-MIB::hrSystemUptime.0"
- save the file and restart your container
Unifi-poller is an application that polls statistics from Ubiquiti Unifi Controller and exports the data to InfluxDB. Let’s process to its installation:
- download the golift/unifi-poller Docker image
- once downloaded, launch the image and configure the container as follows:
- map file docker/unifi-poller/config/unifi-poller.conf to /host/path/up.conf
- use the Docker default Bridge network
- copy following file as docker/unifi-poller/config/unifi-poller.conf
###########################################################
# UniFi Poller v2 primary configuration file. TOML FORMAT #
###########################################################

[poller]
  # Turns on line numbers, microsecond logging, and a per-device log.
  # The default is false, but I personally leave this on at home (four devices).
  # This may be noisy if you have a lot of devices. It adds one line per device.
  debug = false

  # Turns off per-interval logs. Only startup and error logs will be emitted.
  # Recommend enabling debug with this setting for better error logging.
  quiet = false

  # Load dynamic plugins. Advanced use; only sample mysql plugin provided by default.
  plugins = []

#### OUTPUTS

    # If you don't use an output, you can disable it.

[prometheus]
  disable = true
  # This controls on which ip and port /metrics is exported when mode is "prometheus".
  # This has no effect in other modes. Must contain a colon and port.
  http_listen = "0.0.0.0:9130"
  report_errors = false

[influxdb]
  disable = false
  # InfluxDB does not require auth by default, so the user/password are probably unimportant.
  url  = "http://your_host_server_IP_address:8086"
  user = "INFLUXDB_LOGIN_FOR_UNIFI-POLLER"
  pass = "INFLUXDB_PASSWORD_FOR_UNIFI-POLLER"
  # Be sure to create this database.
  db = "YOUR_UNIFI_DB"
  # If your InfluxDB uses a valid SSL cert, set this to true.
  verify_ssl = false
  # The UniFi Controller only updates traffic stats about every 30 seconds.
  # Setting this to something lower may lead to "zeros" in your data.
  # If you're getting zeros now, set this to "1m"
  interval = "30s"

#### INPUTS

[UNIFI_STATS]
  # Setting this to true and providing default credentials allows you to skip
  # configuring controllers in this config file. Instead you configure them in
  # your prometheus.yml config. Prometheus then sends the controller URL to
  # unifi-poller when it performs the scrape. This is useful if you have many,
  # or changing controllers. Most people can leave this off. See wiki for more.
  dynamic = false

# The following section contains the default credentials/configuration for any
# dynamic controller (see above section), or the primary controller if you do not
# provide one and dynamic is disabled. In other words, you can just add your
# controller here and delete the following section. The internal defaults are
# shown below. Any missing values will assume these displayed defaults.
[unifi.defaults]
  url        = "https://YOUR_UNIFI_CONTROLLER_IP_ADDRESS:PORT"
  user       = "LOGIN_ON_UNIFI_CONTROLLER"
  pass       = "PASSWORD_ON_UNIFI_CONTROLLER"
  sites      = ["all"]
  save_ids   = false
  save_dpi   = false
  save_sites = true
  hash_pii   = false
  verify_ssl = false

# The following is optional and used for configurations with multiple controllers.

# You may repeat the following section to poll multiple controllers.
# Any ommitted variables will have their values taken from the defaults, above.
#[[unifi.controller]]
  # URL for the UniFi Controller. Do not add any paths after the host:port.
  # Do not use port 8443 if you have a UDM.
  #url = "https://127.0.0.1:8443"

  # Make a read-only user in the UniFi Admin Settings, allow it access to all sites.
  #user = "unifipoller"
  #pass = "unifipoller"

  # If the controller has more than one site, specify which sites to poll here.
  # Set this to ["default"] to poll only the first site on the controller.
  # A setting of ["all"] will poll all sites; this works if you only have 1 site too.
  #sites = ["all"]

  # Enable collection of Intrusion Detection System Data (InfluxDB only).
  # Only useful if IDS or IPS are enabled on one of the sites.
  #save_ids = false

  # Enable collection of Deep Packet Inspection data. This data breaks down traffic
  # types for each client and site, it powers a dedicated DPI dashboard.
  # Enabling this adds roughly 150 data points per client.  That's 6000 metrics for
  # 40 clients.  This adds a little bit of poller run time per interval and causes
  # more API requests to your controller(s). Don't let these "cons" sway you:
  # it's cool data. Please provide feedback on your experience with this feature.
  #save_dpi = false

  # Enable collection of site data. This data powers the Network Sites dashboard.
  # It's not valuable to everyone and setting this to false will save resources.
  #save_sites = true

  # Hash, with md5, client names and MAC addresses. This attempts to protect
  # personally identifiable information. Most users won't want to enable this.
  #hash_pii = false

  # If your UniFi controller has a valid SSL certificate (like lets encrypt),
  # you can enable this option to validate it. Otherwise, any SSL certificate is
  # valid. If you don't know if you have a valid SSL cert, then you don't have one.
  #verify_ssl = false
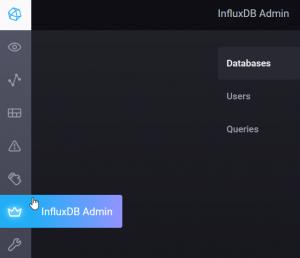
- browse to Chronograf and create user INFLUXDB_LOGIN_FOR_UNIFI-POLLER and database YOUR_UNIFI_DB as declared in config.yaml
- start unifi-poller container
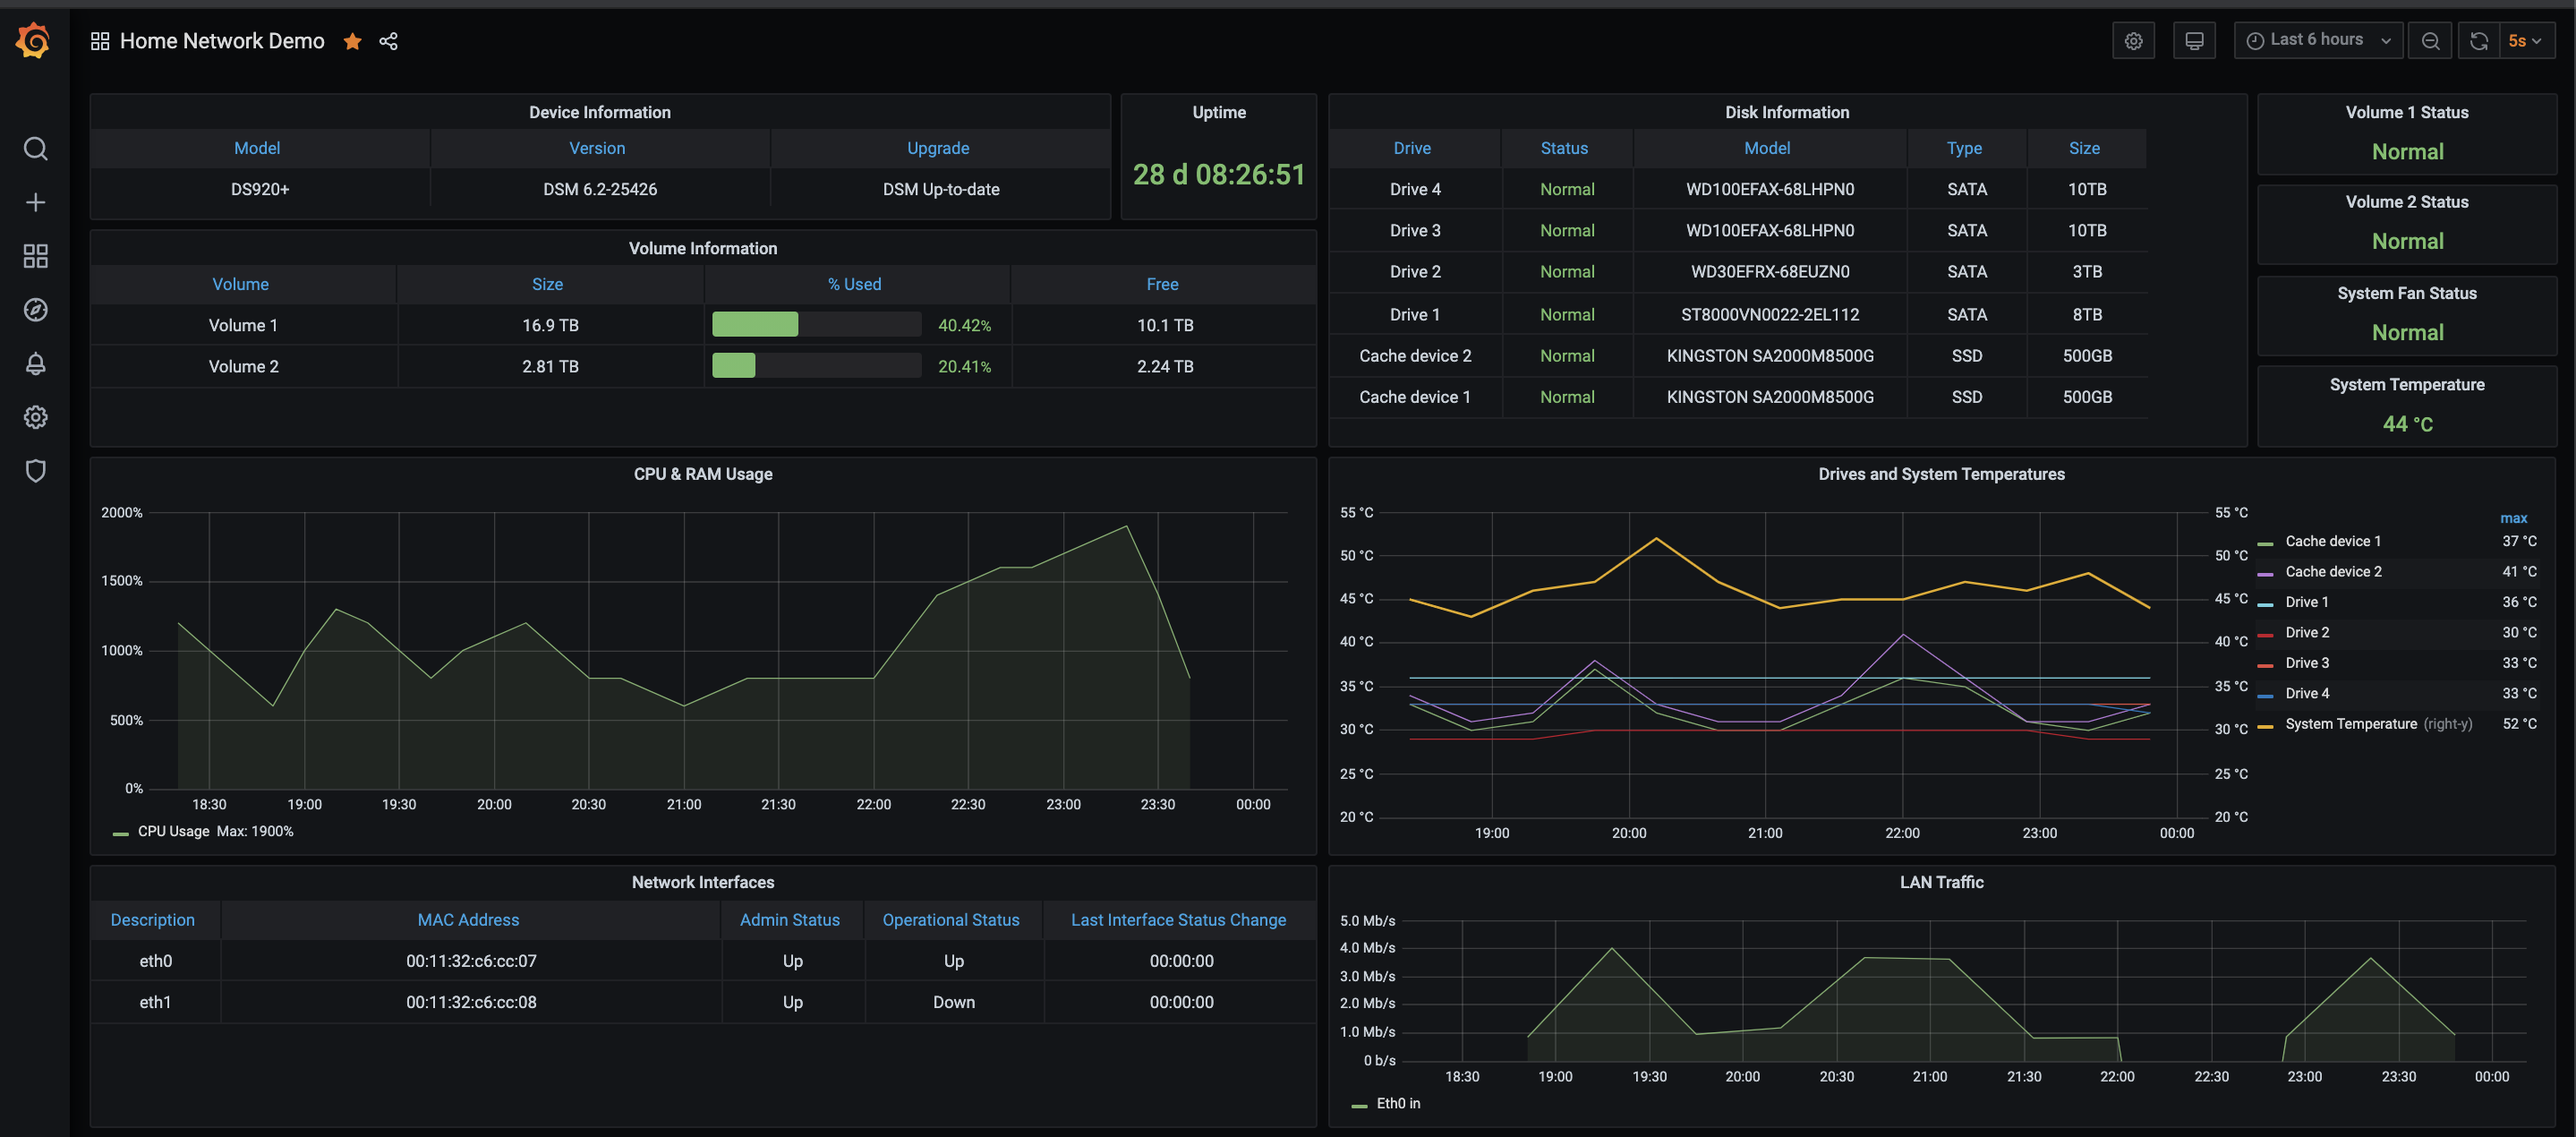
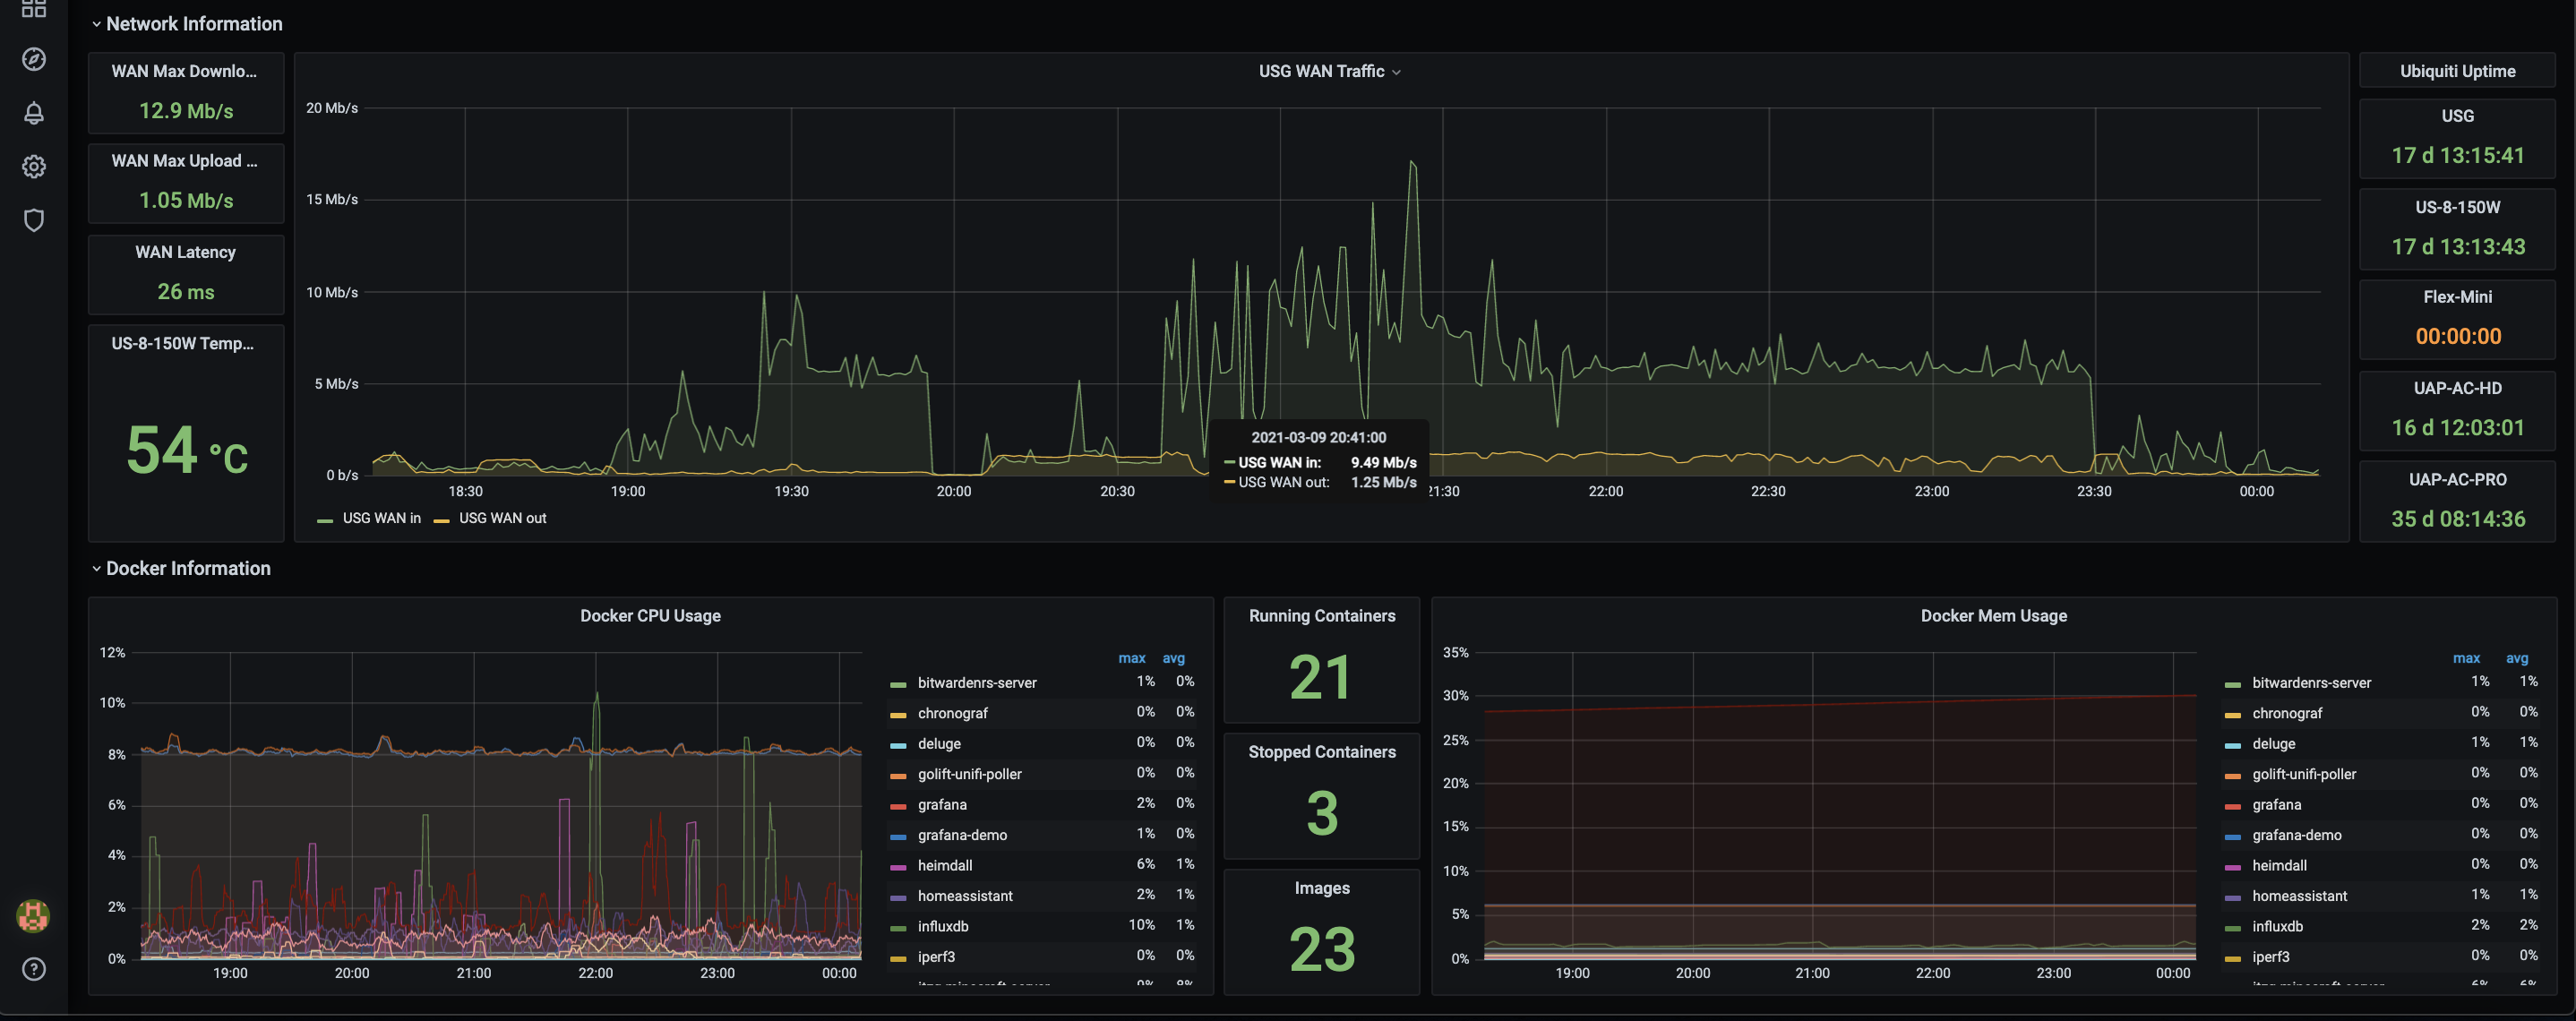
Grafana is an open source application that allows you to query, visualize and alert on metrics and logs no matter where they are stored.
It pulls data from databases such as InfluxDB, among others and presents them in amazing customizable dashboards.
Installation guide:
- download grafana Docker image
- launch the downloaded image with following parameters:
- map Volumes docker/grafana to /var/lib/grafana
- use the default Docker Bridge Network
- map ports 3003 (or any value of your choice as local port) to 3000 TCP (as container port)
- run the container
- browse to Grafana: http://your_host_server_IP_address:3003
- add your databases (created with Telegraf and Unifi-poller):
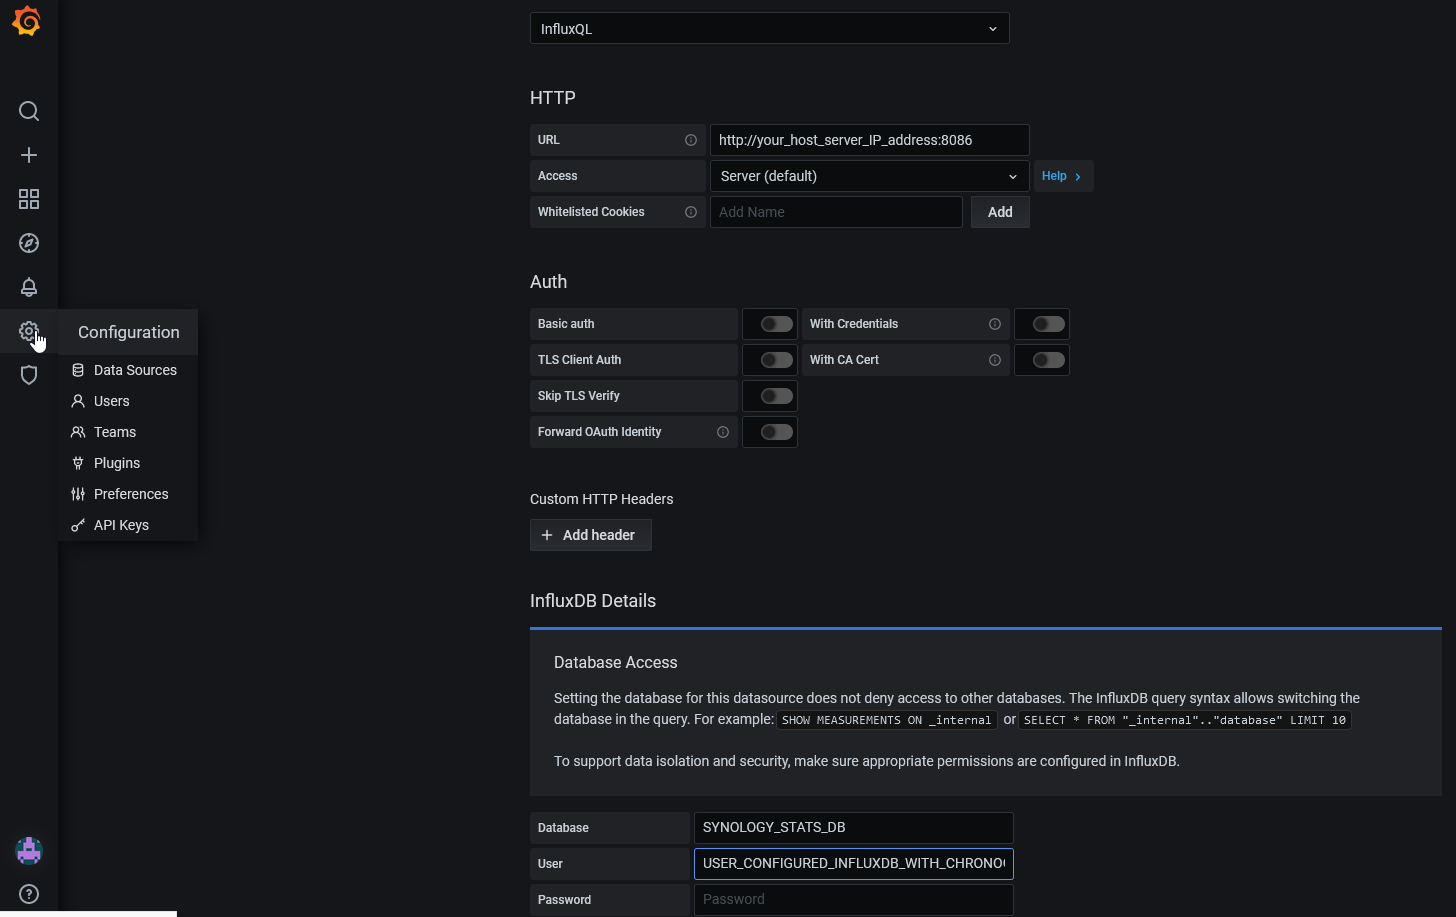
- you can now start creating dashboard with creation of queries to your databases.